In this blog let us understand the basics of the Z-score. This is useful to know how the data is distributed.
Let us start.
Examples:
Dataset A is : 10, 12, 14, 16.
Dataset B is: 10, 200, 350, 600.
As you can see, both the mean of B (290) and the standard deviation of B (13) are higher than that of A.
Now let us consider two more datasets.

Dataset C is: 10, 30, 40, 60.
Dataset D is: 31,33,36,40.
The mean of dataset C and dataset D is the same (35).
But what about standard deviation? Are they equal?
No, even though the means of C and D are equal, standard deviations are different.
The standard deviation of dataset C (20.8) is higher than dataset D (3.9).
In summary, to understand how the data are distributed, we need both the mean and standard deviation.
While the mean conveys the central point, the standard deviation tells us the spread of the data.
Z-score formula
The next concept is the Z-score. What is a Z-score?
In simple words, the Z-score combines both the mean and standard deviation of the data.

What is x here? x is a value. µ is the mean and σ is the standard deviation.
Now let us understand Z-scores with examples.

If the mean is 20, and the standard deviation is 2, then the Z score for x=20 is 0.
But if the value of x is far away from the mean, let us say x is 30, then the Z score is 5.
Similarly, if the value of x is on the lower side, that is, let us say x is 10, then also Z score is -5, that is minus 5.
The Z-score is positive for values on the right side of the mean and negative for values on the left side.

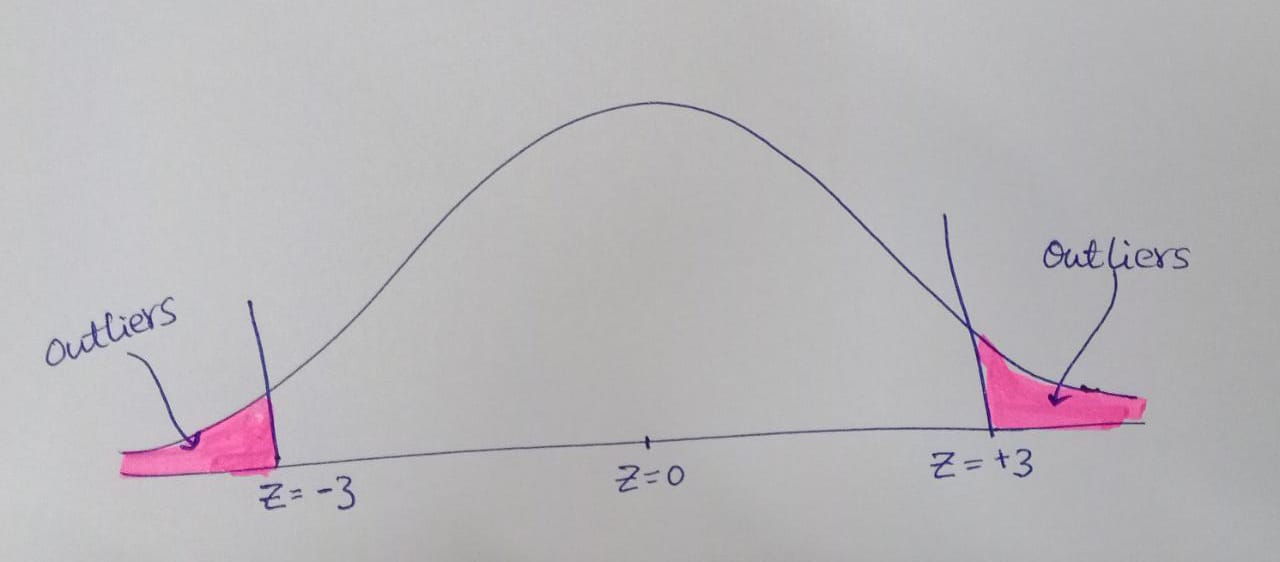
As you can see, a Z-score of 0 lies in the central part of the distribution.
Assuming the normal distribution, between -3 to +3 Z-score, 99.7% of data lie.

Advantages of Z-score:
- To compare different datasets
Though it appears that 80 is greater than 60, it may not be the case always.
What if the exam that Peter faced was tough?
In such cases, if we know how other students performed in these two exams, we can use this information for better comparison.
The Z-score uses mean and standard deviation.
Hence if we are told that Z-score for John is 1.5, while Peter's is 2.5.
Then we can understand that Peter performed better.

- To identify outliers
- To find out the relative position of a particular value


- Z-score cannot be calculated for nominal (e.g. city names, zip code) or ordinal data (e.g. low, medium and high)
- Assumption of normality though applies to the majority of the situations, but may not hold good always
No comments:
Post a Comment